
A Fundamental Misunderstanding of Physics
This is the fourth post in a series examining average power calculation errors in fitness devices. The first post examined Apple's fundamental calculation errors across various data types. The second post quantified these errors using real-world cycling power data from an Apple Watch over eight months. The third post revealed that Garmin makes identical mistakes in their average power calculations. This post performs a detailed comparison of simultaneously recorded Garmin and Apple Watch data from three rides to understand why their reported values differ and what the underlying measurements reveal.
Neither Company Understands Energy and Power
The evidence from the first three posts shows that neither Apple's health team nor Garmin's engineers grasp the basic physics of energy and power. This is a fundamental conceptual error in how these companies calculate average values.
The physics is straightforward:
Energy always equals Power × Time
Power is always Energy ÷ Time
Average Power is simply Energy ÷ Total Time
Where Energy is the sum of each individual power sample multiplied by the time interval of that sample. This isn't advanced physics—it's undergraduate-level mechanics. Yet both companies calculate “average power” by simply adding up all power readings and dividing by the count. This arithmetic mean of readings is not average power unless every sample represents exactly the same time duration.
From the December 6, 2025 ride analyzed in the third post:
Garmin reported: 230W (true average: 218.3W, error: 5.5%)
Apple reported: 256W (true average: 221.0W, error: 12.7%)
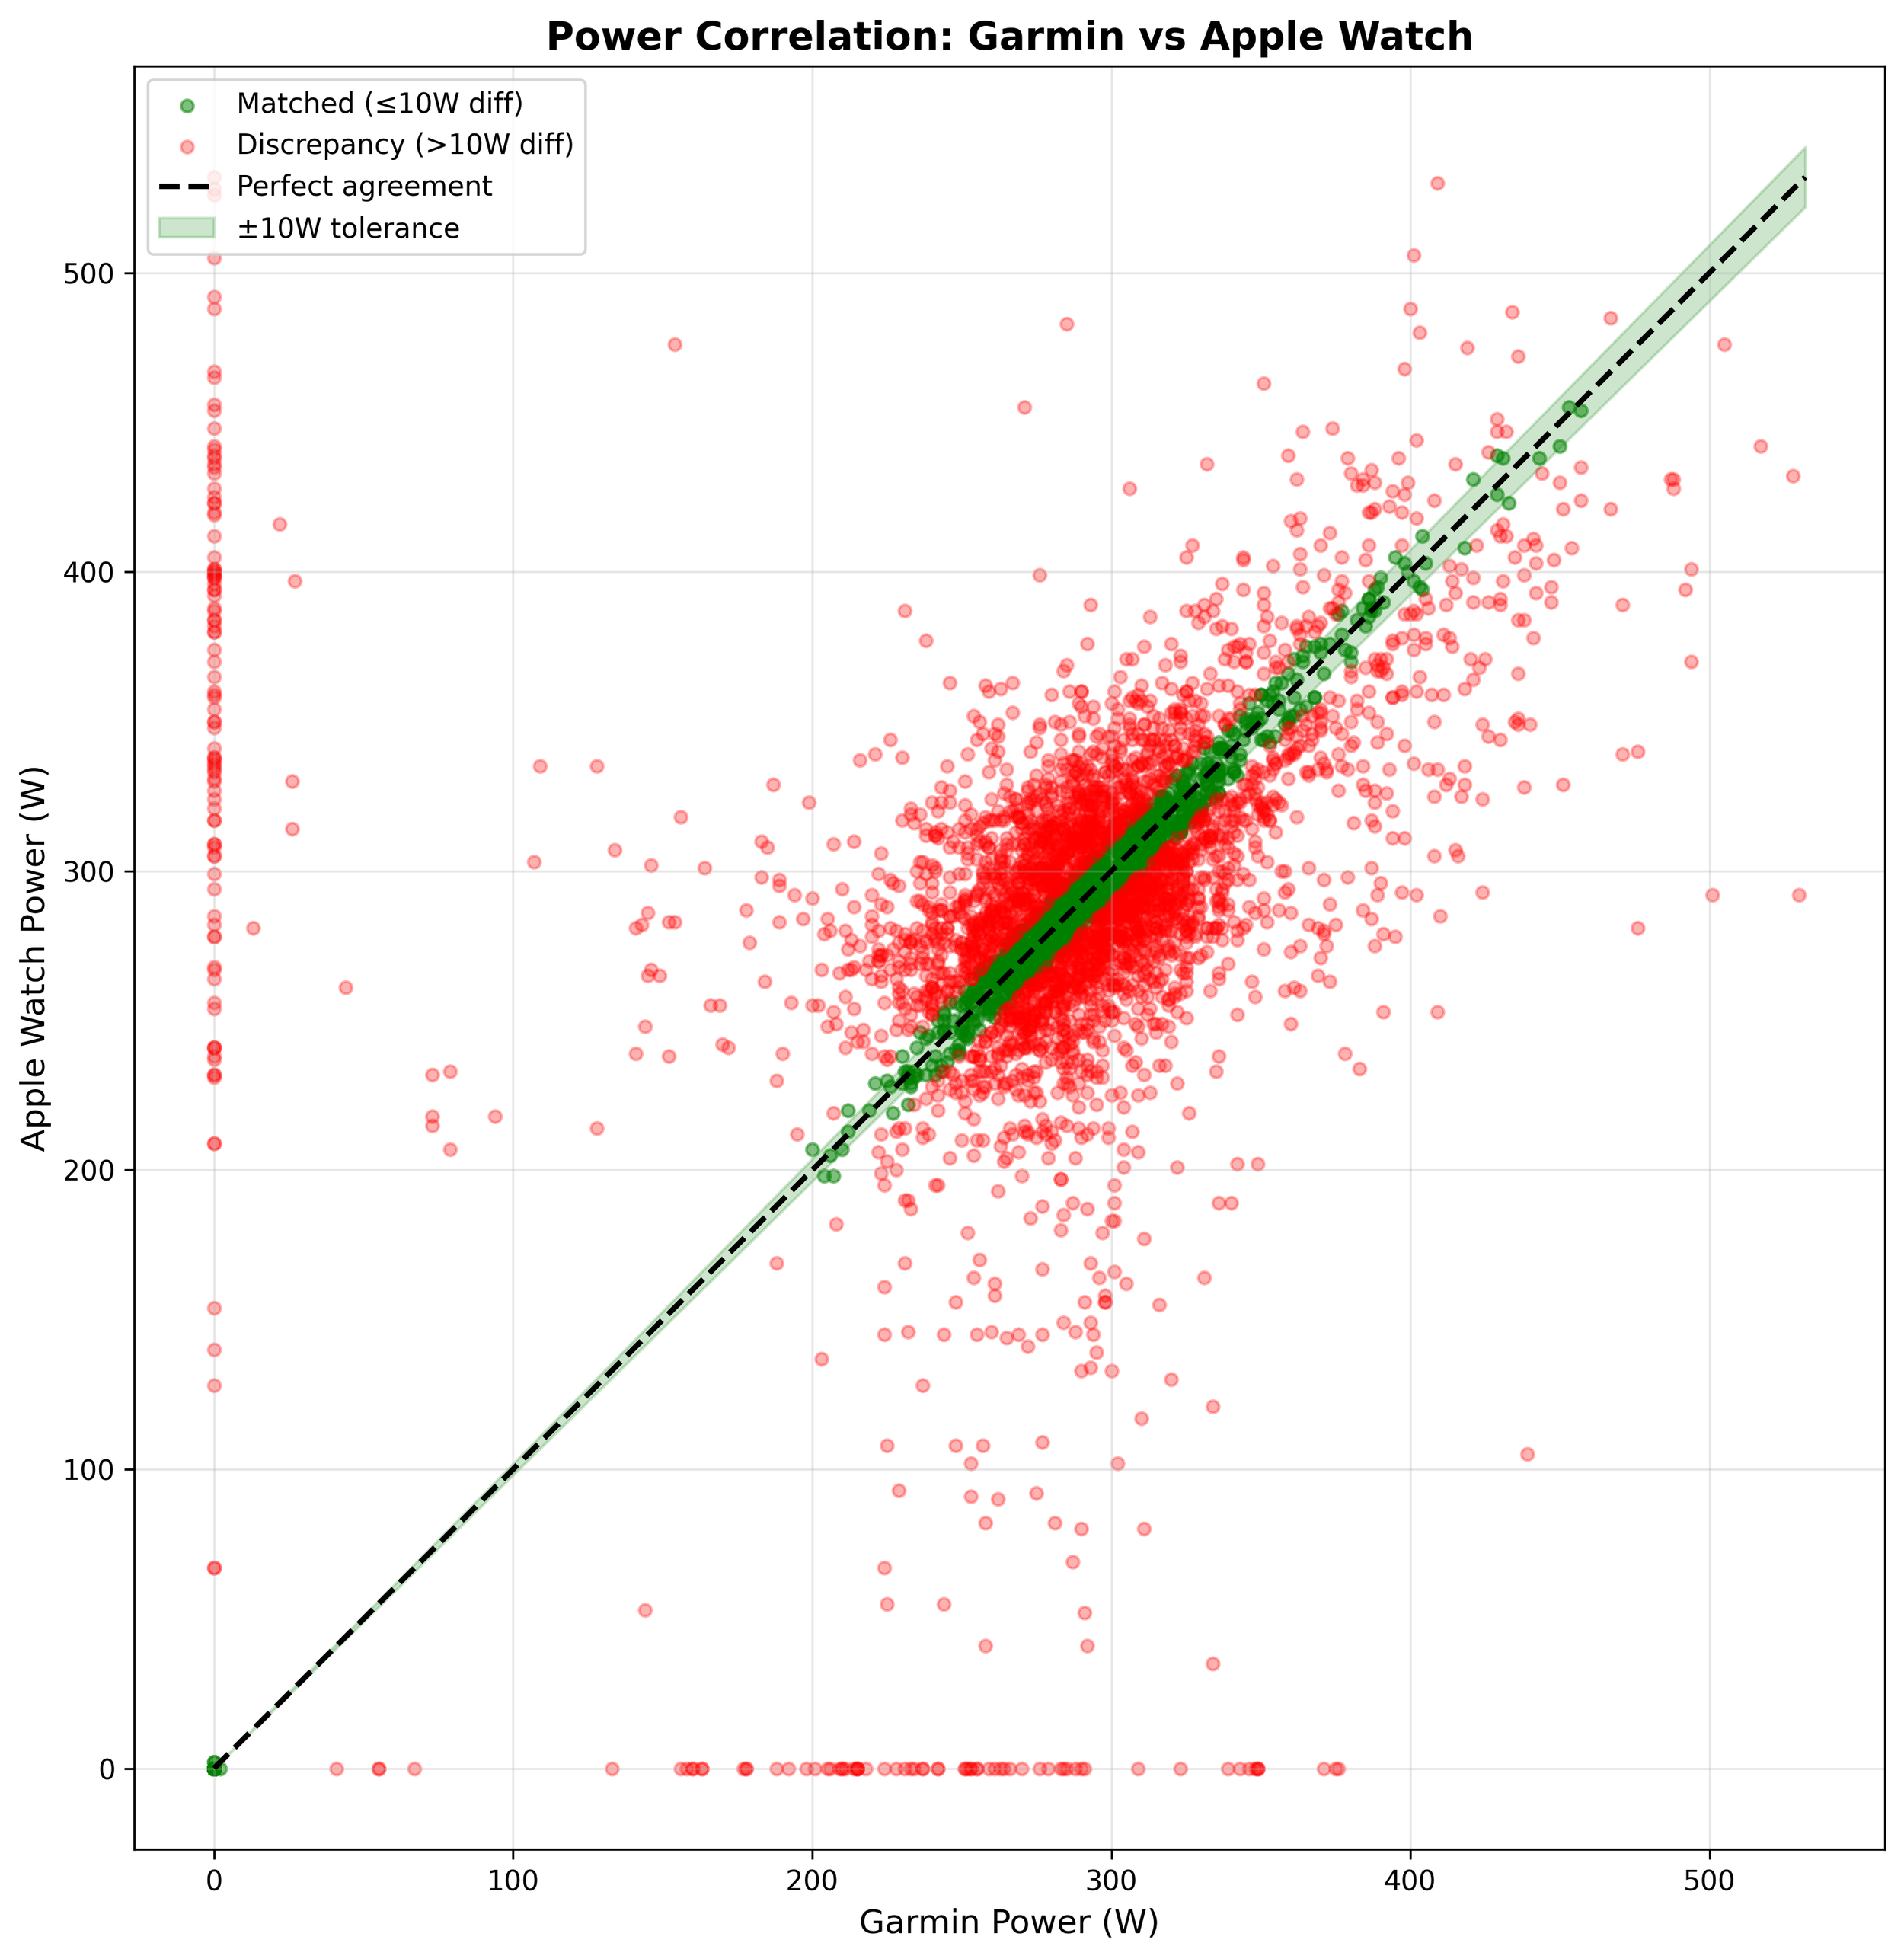
Both devices' raw data show nearly identical true average power (within 1.2%), but their displayed values differ by 26W. This pattern holds across all rides analyzed.
Three Rides, Over 26,000 Data Points
I recorded three rides with simultaneous power measurements from both devices, both connected to the same 4iiii Precision Pro dual-sided power meter:
Ride 1 (December 6, 2025): 2h 5m, 7,186 Garmin points, 6,644 Apple Watch points
Ride 2 (December 7, 2025): 1h 7m, 3,843 Garmin points, 3,709 Apple Watch points
Ride 3 (December 10, 2025): 1h 17m, 4,356 Garmin points, 4,256 Apple Watch points
For each ride, I exported the raw data containing every timestamp and power reading, allowing detailed analysis of both the arithmetic mean and true average power.
The Numbers Reveal the Pattern
Here are all three rides compared side by side:
The Numbers Reveal the Pattern
| Ride | Metric | Garmin | Apple | Difference |
|---|---|---|---|---|
| Ride 1 (Dec 6, 2025) | Reported Values | 230W | 256W | 26W (10.2%) |
| Arithmetic Mean | 228.5W | 249.4W | 20.9W (8.4%) | |
| True Average Power | 218.4W | 221.0W | 2.7W (1.2%) | |
| Ride 2 (Dec 7, 2025) | Reported Values | 259W | 269W | 10W (3.7%) |
| Arithmetic Mean | 257.2W | 266.6W | 9.4W (3.5%) | |
| True Average Power | 248.2W | 244.4W | 3.7W (1.5%) | |
| Ride 3 (Dec 10, 2025) | Reported Values | 269W | 277W | 8W (2.9%) |
| Arithmetic Mean | 268.2W | 275.2W | 7.0W (2.5%) | |
| True Average Power | 254.0W | 252.8W | 1.1W (0.4%) |
The pattern is unmistakable:
Reported values differ by 3-10% between devices
Arithmetic means differ by 2.5-8.4% between devices
True average power differs by only 0.4-1.5% between devices
When calculated correctly—as total energy divided by total time—both devices agree almost perfectly. The underlying measurements are accurate; the calculation methodology is wrong.
Why Apple's Error Exceeds Garmin's
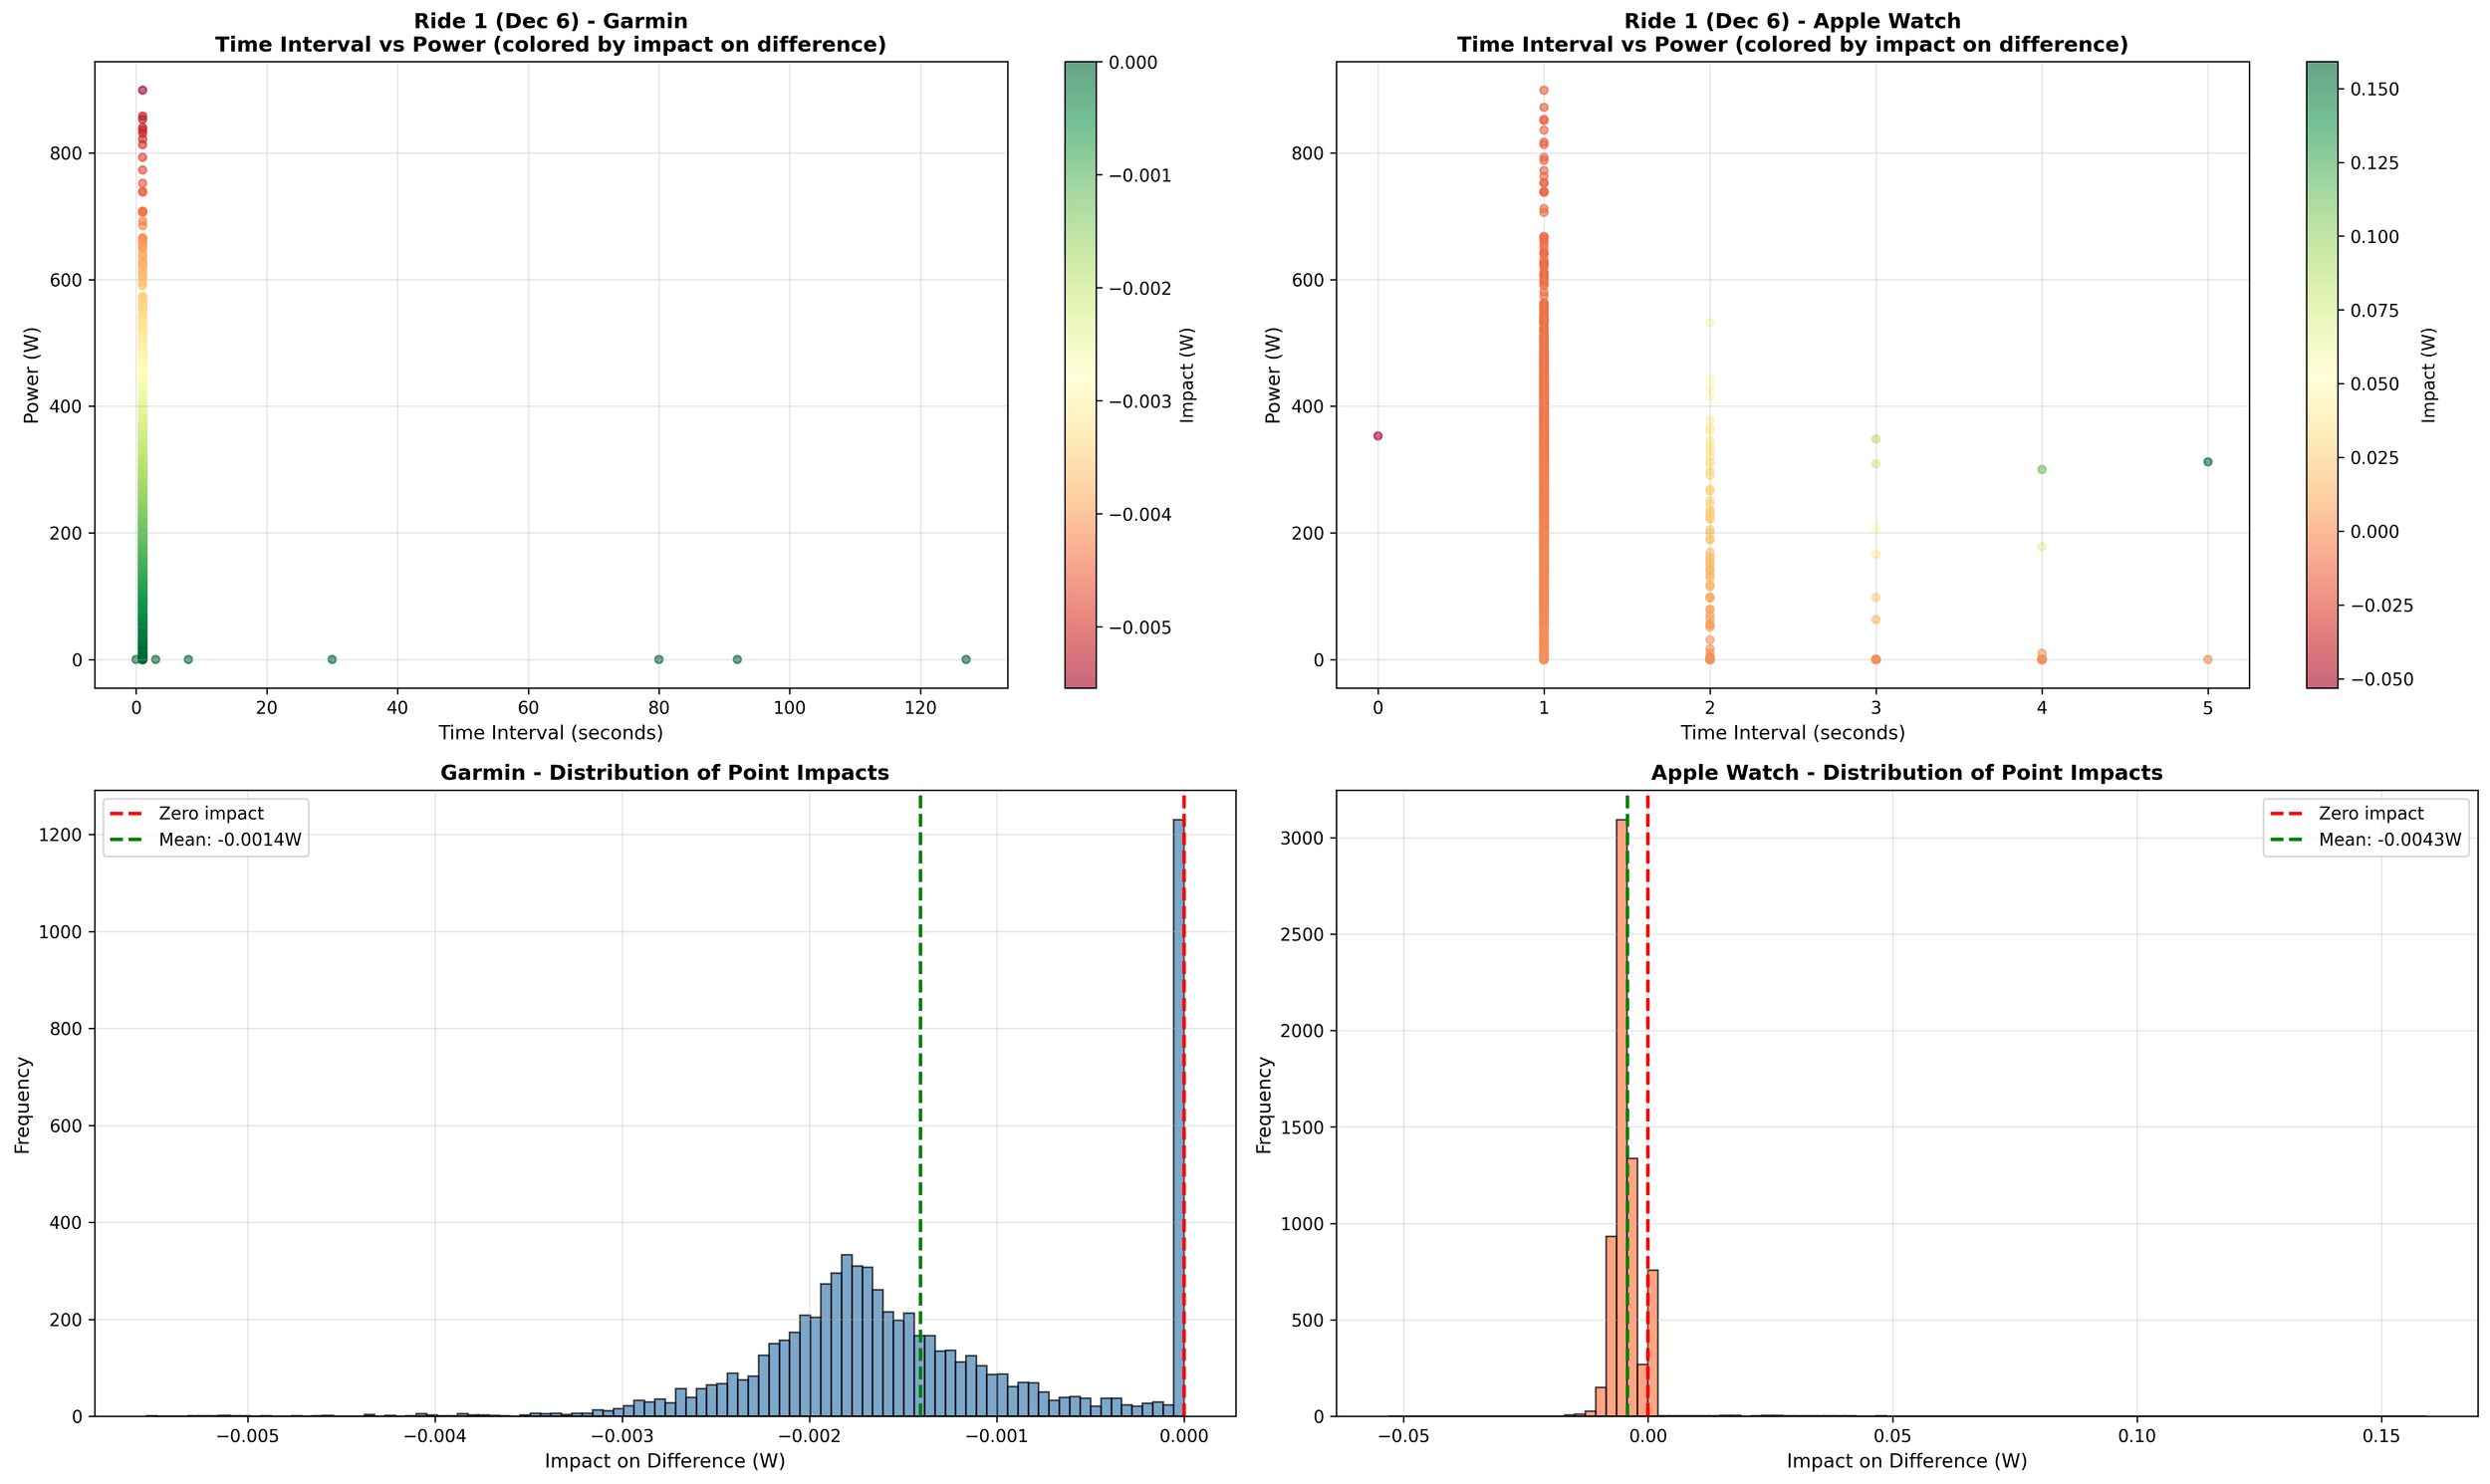
As established in the second post, Apple Watch samples with highly variable time intervals (mean: 0.8s, standard deviation: 1.35s). Some samples represent 5+ seconds while others are just 1 second apart.
Garmin samples very consistently at 1Hz—almost all intervals are exactly 1 second.
The arithmetic mean treats every reading equally, regardless of duration. A 400W reading gets identical weight whether it represents 1 second or 5 seconds of effort.
True average power weights each reading by its actual duration. A 400W reading lasting 1 second contributes 400 watt-seconds (joules) of energy. A 200W reading lasting 10 seconds contributes 2,000 watt-seconds (joules)—correctly reflecting 10x longer duration at that power.
Garmin's consistent sampling means its arithmetic mean is biased by capturing every brief power spike. Each 800W sprint lasting 1 second gets equal weight to each 200W cruise effort lasting 1 second. In true average power, both contribute exactly 1 second worth of energy—which is correct.
Apple's variable sampling creates additional bias. A 312W reading lasting 5 seconds represents 1,560 watt-seconds or joules of energy, but in the arithmetic mean counts the same as a 312W reading lasting just 1 second (312 watt-seconds or joules). Longer-duration readings at moderate power inflate Apple's arithmetic mean more than Garmin's uniform sampling does.
I analyzed every data point to determine its impact—how much it pushes the arithmetic mean away from true average power:
Garmin: 83-91% of points push arithmetic mean upward, with tightly clustered impacts due to uniform sampling
Apple: 88-92% of points push arithmetic mean upward, but with outlier points (0.4-1.1%) having very long time intervals that create partial offset
The Magnitude of the Error
Here's how wrong the reported values are:
The Magnitude of the Error
| Ride | Device | Reported | Should Report | Error | Error % |
|---|---|---|---|---|---|
| Ride 1 (Dec 6) | Garmin | 230W | 218.4W | +11.6W | 5.3% |
| Apple | 256W | 221.0W | +35.0W | 15.8% | |
| Ride 2 (Dec 7) | Garmin | 259W | 248.2W | +10.8W | 4.3% |
| Apple | 269W | 244.4W | +24.6W | 10.1% | |
| Ride 3 (Dec 10) | Garmin | 269W | 254.0W | +15.0W | 5.9% |
| Apple | 277W | 252.8W | +24.2W | 9.6% | |
| Average Across All Rides | Garmin | — | — | +12.5W | 5.2% |
| Apple | — | — | +27.9W | 11.8% |
Apple's error is consistently more than double Garmin's. Both violate basic physics, but Apple's misunderstanding produces larger errors due to their variable sampling strategy.
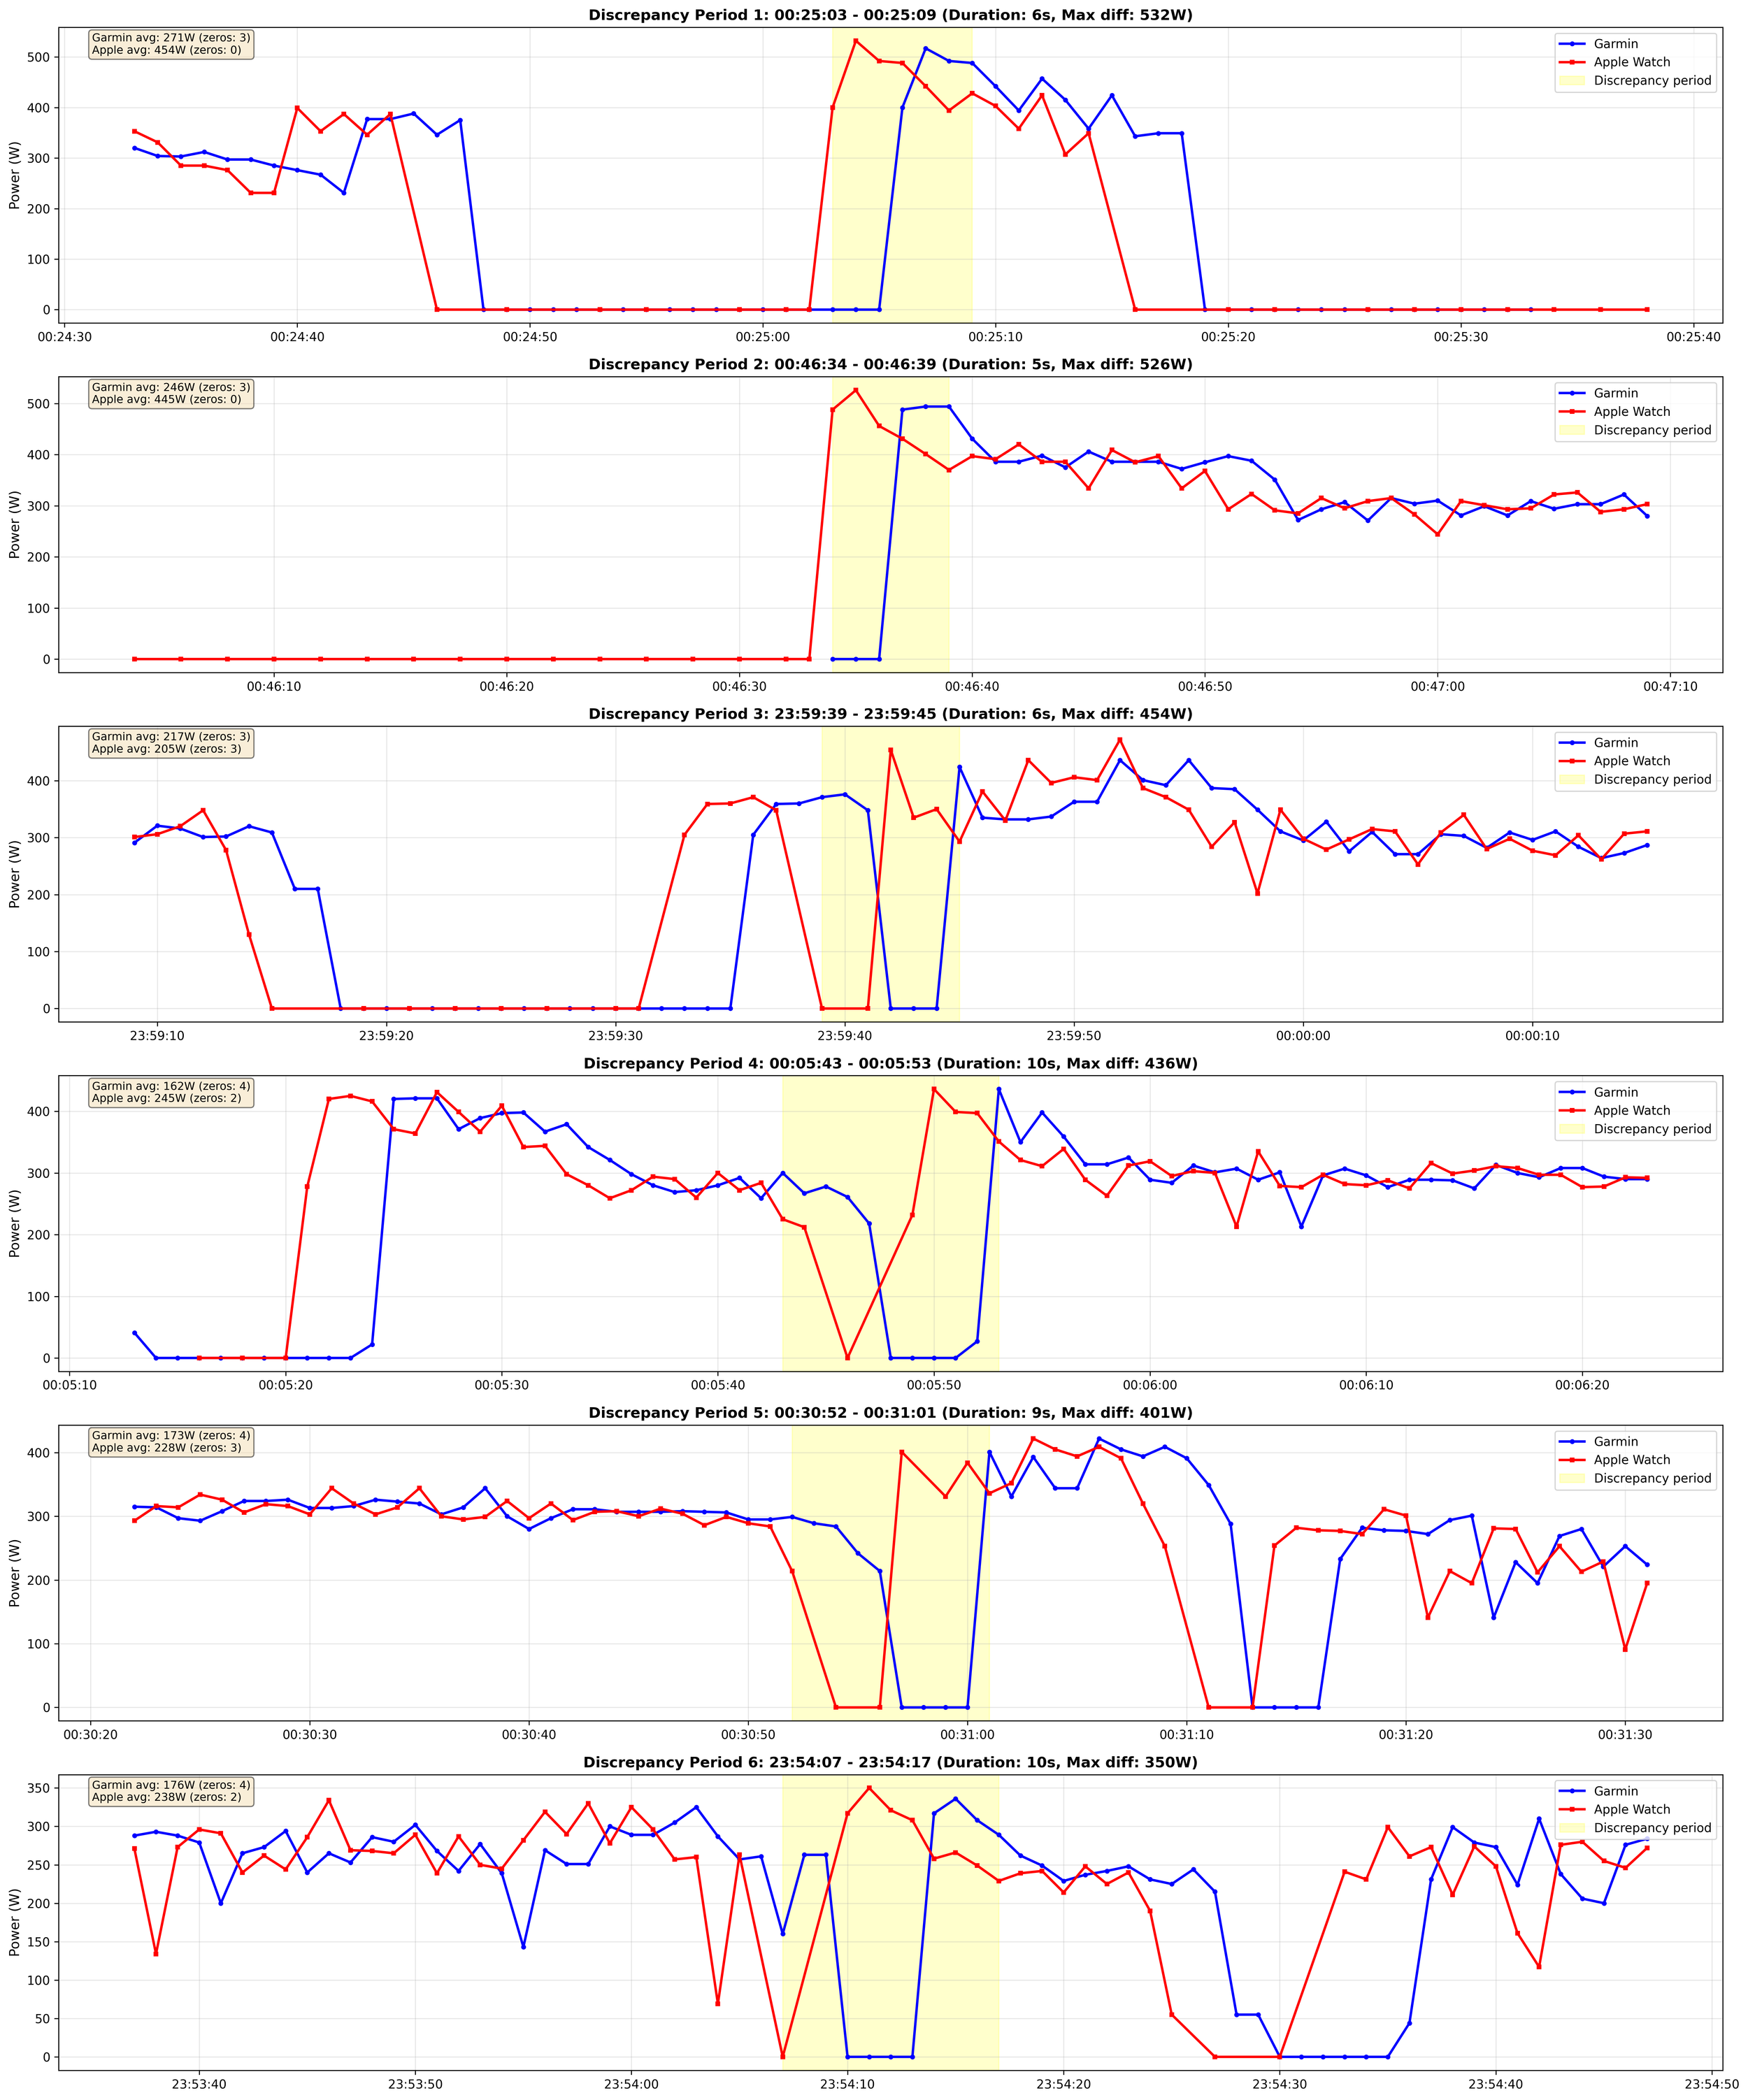
Data Quality: Connectivity Issues
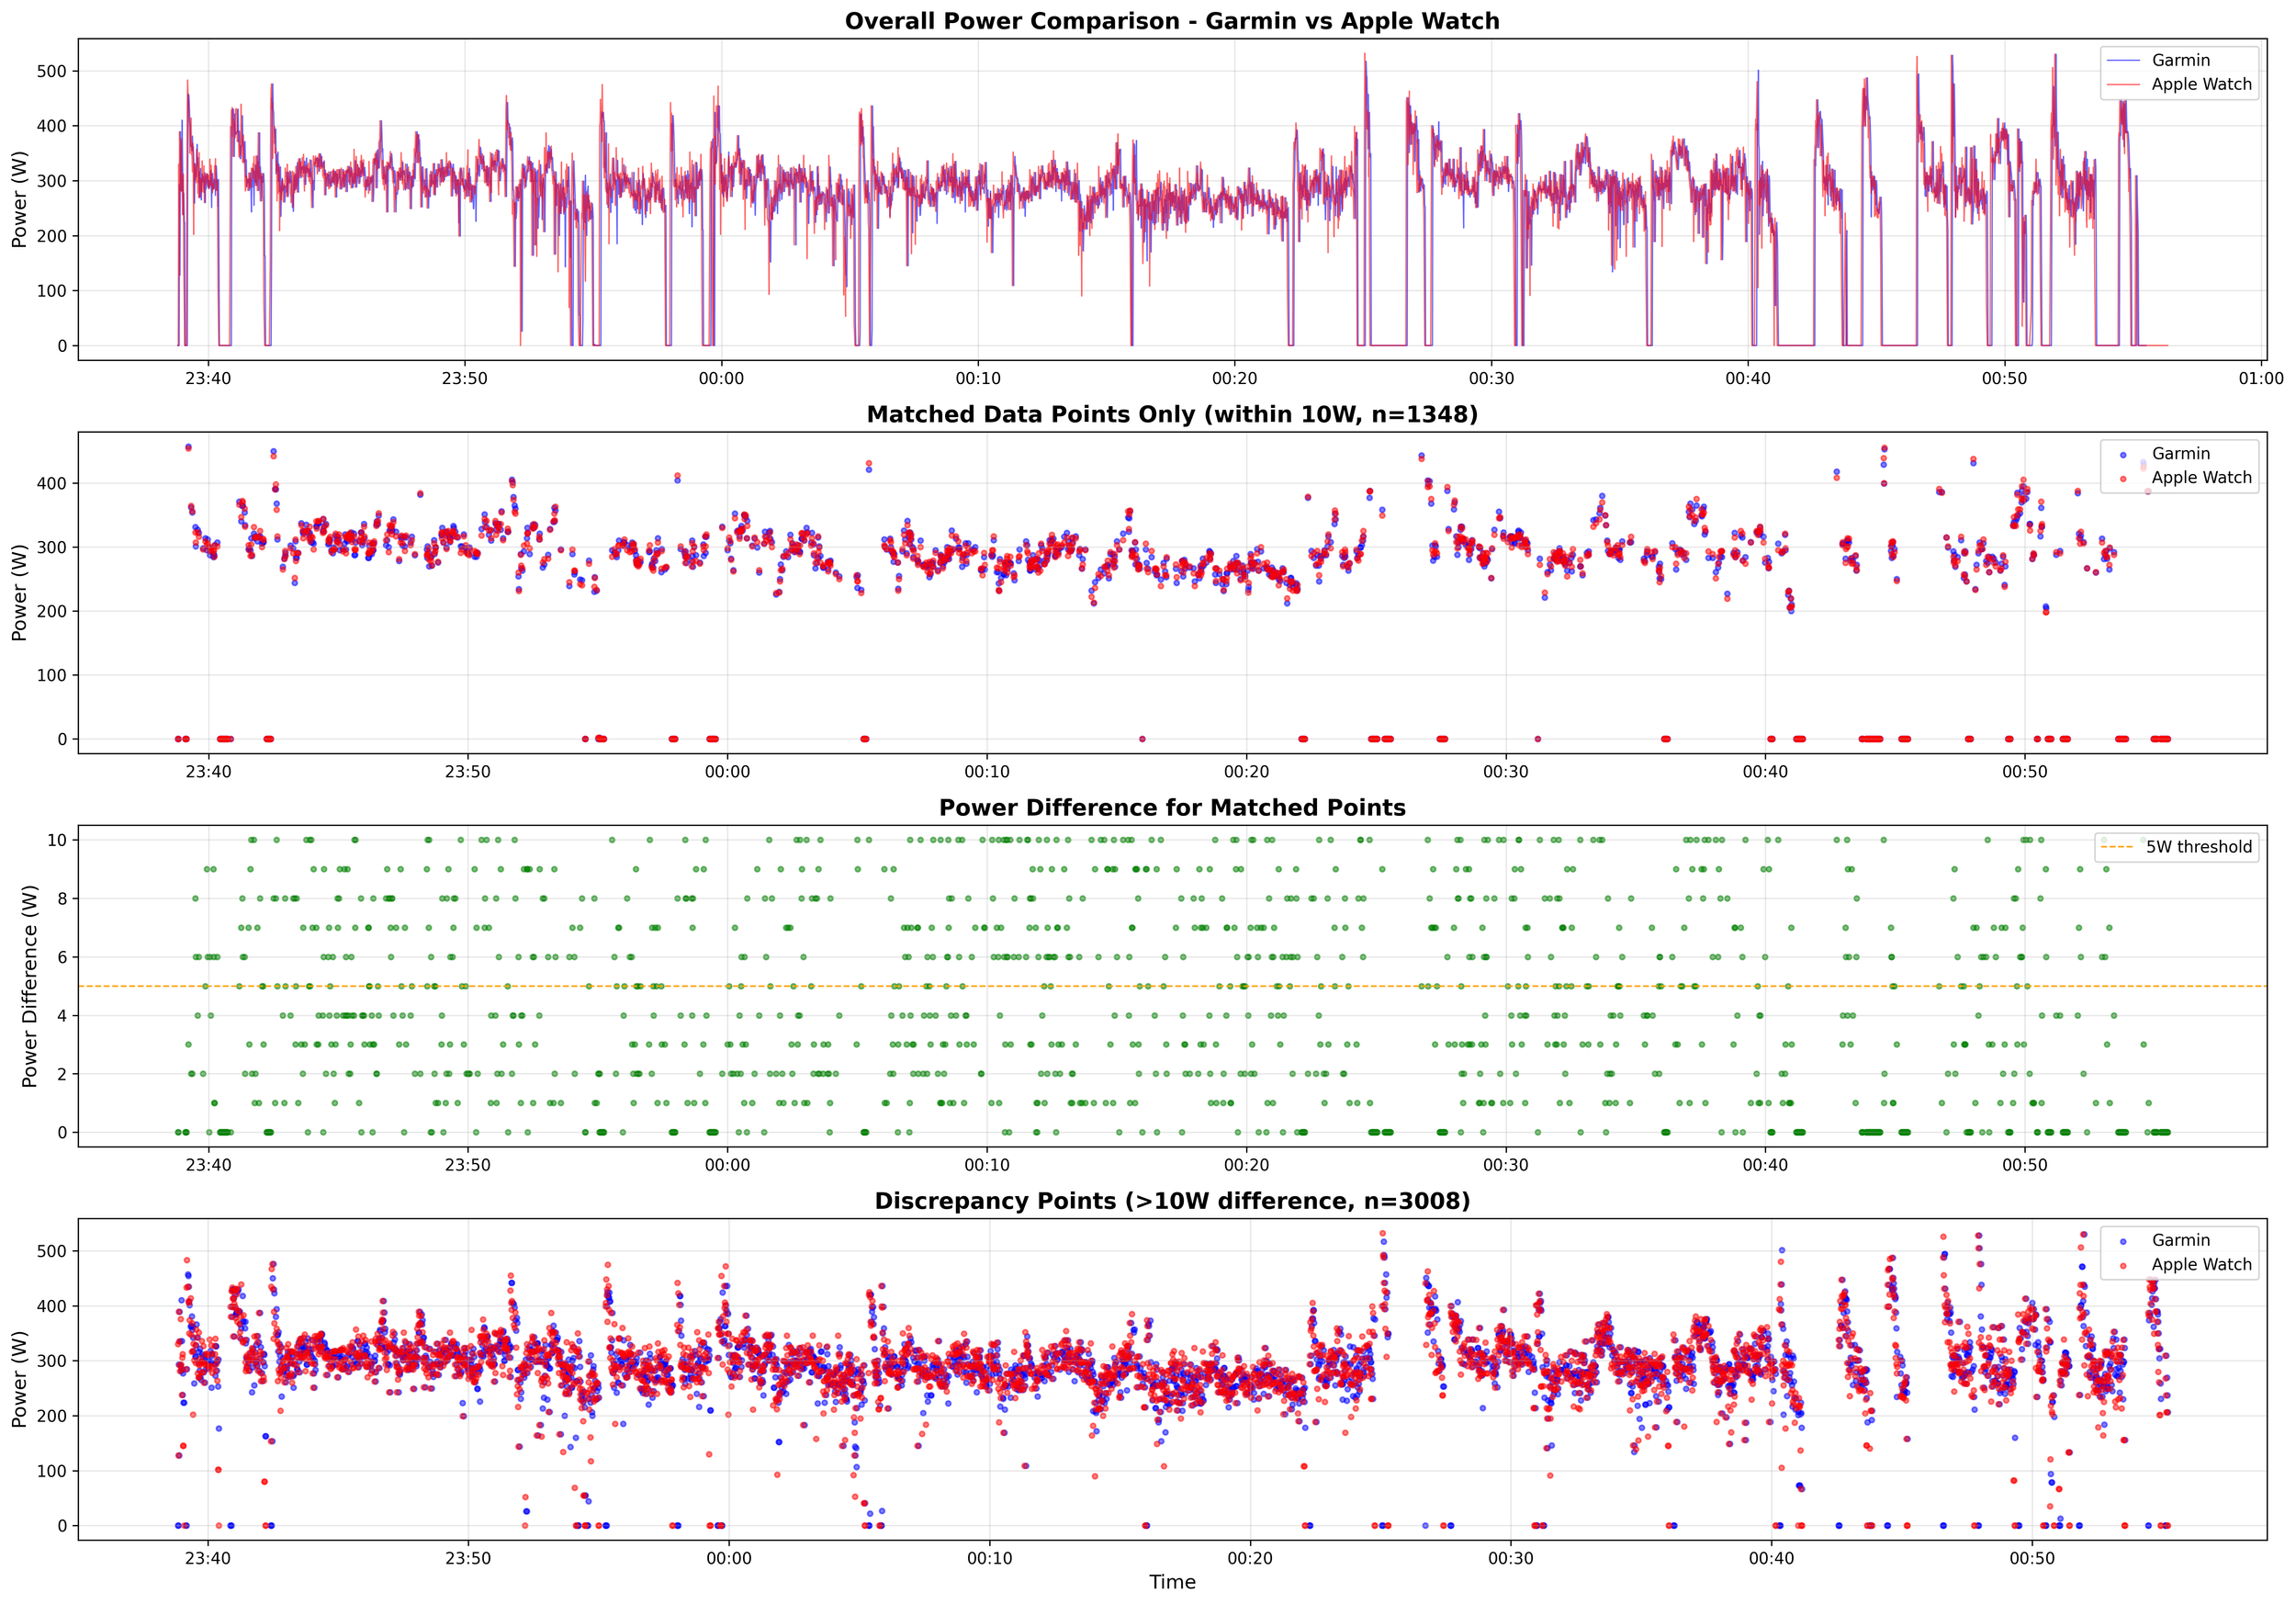
Beyond calculation errors, both devices suffer connectivity dropouts—periodically recording 0W when the power meter transmits data:
Data Quality: Connectivity Issues
| Metric | Ride 1 (Dec 6) | Ride 2 (Dec 7) | Ride 3 (Dec 10) |
|---|---|---|---|
| Both Working | 79.0% | 88.2% | 89.0% |
| Garmin Dropouts | 416 (5.8%) | 68 (1.8%) | 103 (2.4%) |
| Apple Dropouts | 307 (4.3%) | 42 (1.1%) | 73 (1.7%) |
| Major Discrepancy Periods | 115 | 1 | 12 |
Garmin experiences 1.4-1.6x more frequent dropouts but they're shorter (9-13 consecutive zeros average, longest: 66 seconds).
Apple Watch has fewer dropouts but they last longer (6-10 consecutive zeros average, longest: 145 seconds).
When both devices successfully record data simultaneously, they agree remarkably well: 3-4W average difference on instantaneous power, with 0.16-0.28 second time synchronization. The measurement hardware works correctly—the problem is purely in the calculation.
Why This Matters
Average power isn't cosmetic—it's foundational for:
Energy expenditure: Total work determines caloric burn
Performance trends: Comparing fitness over time
As shown in the second post, Apple's incorrect calculation produces inconsistent efficiency values (mean 20.0%, SD 1.7%) when comparing reported average power to reported active energy. Correct calculation would yield constant efficiency.
These 5-12% errors compound throughout training analysis, making load calculations unreliable and progress tracking misleading.
What You Should Do
Never trust displayed “average power.” Both companies display arithmetic mean of readings, which violates the physics definition of average power.
The Uncomfortable Question
How do sophisticated engineering teams at Apple and Garmin get undergraduate physics wrong? The correct calculation—numerical integration to compute energy, then divide by time—dates back to the 1800s. This isn't about corner cases or edge conditions. It's about the fundamental definition of average power. Average power is energy divided by total time. Always. Yet here we are, with millions of cyclists trusting “average power” values that aren't average power at all as defined in physics.
The Silver Lining
When you calculate average power correctly from raw data, both devices agree within 0.4-1.5% across all rides. The sensors work. The connectivity protocols work (mostly). The devices faithfully record accurate power measurements.
The only failure is in the final calculation shown to users. This is simultaneously frustrating and encouraging—frustrating because it's such a basic error, encouraging because the underlying data is sound.
Conclusion
Both Apple and Garmin display values that violate the physics definition of average power. The errors are substantial (5-12% overestimation) and consistent across devices and rides.
But the root cause appears to be conceptual rather than malicious. Neither company seems to understand that average power requires weighting by time duration, not just averaging the numbers collected. This is basic physics yet somehow it's being implemented incorrectly by major fitness technology companies.
For now, the solution is clear: don't trust what the devices display.
All analysis and visualizations were performed using Python with raw data exported from both devices. Complete methodology and code are available for verification.